In a world that looks more and more like a science fiction novel, it can be tempting to assume that a computer program or code can do all your tedious work for you. Algorithms suggest videos you might like to to watch on YouTube, plan your road trips to visit friends, and can even frost a cake you ordered for your sister’s birthday with a picture of her face in the center. It doesn’t seem like a leap of faith to assume they can help make astronomical research easier as well.
It should be simple for an algorithm to sort images of blurry dots. But when those dots are galaxies larger than our own, some of which are previously undetected because of how far away they are, it can be hard to train a computer program. Instead, my collaborators and I must visually inspect hundreds of dots and blobs in our images, trying to see if any of them are worth examining in more detail.

Our project’s goal is to study the star formation rate of galaxies at different times in cosmic history, stretching back to 12 billion years ago. To do this, we take photographs of the night sky, using filters, to only see specific wavelength ranges. These filters help isolate different chemical elements, which are used as clues about how far away a star-forming galaxy is. We also collect more detailed data on how much light is seen at each wavelength. This helps us see the redshift of the galaxy: if a line (a spike in the graph of the spectrum as seen below), like a line indicating the presence of oxygen, has shifted towards a smaller wavelength in order to be seen in our narrow filter, then the object must be very far away. By examining how much a line has shifted, we can determine how far away an object is.
It’s rather like birthday cards, where different symbols indicate different ages. Cards for toddlers usually have a cute animal with lots of bright colors, those for young adults often depict people drinking, and ones for people over fifty may display gravestones or black and white photographs. No numbers are needed to tell you the age range of the intended recipient.
It may not be a perfect diagnosis, but by using visual cues, like prominent elements, we are able to determine how far away a galaxy is. Hydrogen indicates a galaxy close by, whereas a galaxy with strong Lyman alpha emission indicates a distant and much younger galaxy. There’s only one problem: with only the initial images, we don’t know what element is causing it to show up in our filter. All we can see is a black dot. And this is where human judgement becomes important. We can create a computer code to filter out a lot of things in our images that are obviously not what we are looking for, but the rest require human judgment.
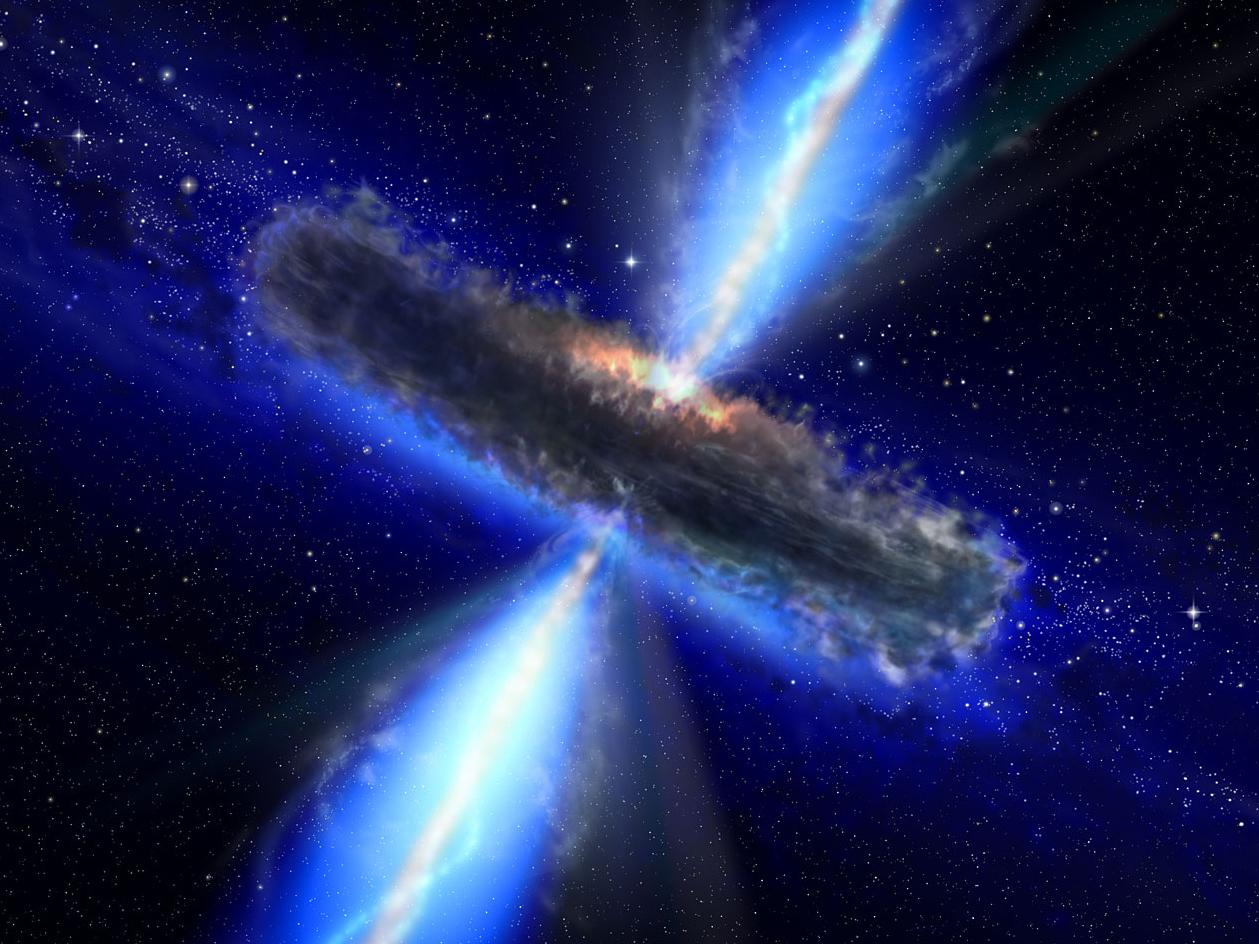
Sometimes, the numbers seen by the computer indicate that something is likely to be excluded, but to an astronomer, a different clue is a sign of a possible quasar—an extremely distant galaxy that shoots out energy like a cosmic lighthouse—and we want to keep those. Our code cannot glean that information from the data we give it. It is up to us to look at the comparison images and decide if the dot looks like a camera artifact, an object that is too spread out, or is actually a strong dot that we are searching for.
The work may be tedious, and is sometimes only tolerable when paired with a good playlist or podcast, yet it is necessary. In this case, computer programs are simply not capable of doing the things that we can do ourselves – the job is left to us . By analyzing these images manually, and looking in detail at what elements are being detected, we can determine how far away the objects are and calculate the rate at which they are forming stars. Maybe one day we will be able to train our code to do more, but for now, nothing can quite replace the human judgement.
Edited by Rachel Skipper and Karna Desai

Leave a Reply