
Ever wonder who uses the services of the CITL—our consultations, workshops, grants, and other programs? Well, you may not consider that question too deeply, but part of my job as CITL director is to understand who uses our services, what that tells us about our reach and impact on campus, and how it might inform our planning for future programming. I am always trying to tease out the differences between interesting data and useful data, and here are a few tidbits about our faculty clients that I find most worth sharing.
Percentage of Instructors Served
From 2015-2017, we saw approximately 26.4% of the tenure track faculty, 39.5% of the non-tenure track faculty, and 29% of Associate Instructors. Those numbers are always a bit wobbly, since our data sets don’t indicate how many of those tenure track faculty and AIs have teaching assignments that might send them to us. We are fairly comfortable with these broad percentages, although 1) we would like to increase the percentage of tenure track faculty we serve; and 2) we are making focused efforts at increasing participation by new faculty members, hoping that will increase our reach in the long term.
Individual Consultations
In the calendar year 2018, we had 2,694 individual consultations with IUB instructors, representing 1,026 individual clients. While we haven’t yet analyzed the ranks of these recent users, data from 2015-17 shows us the following breakdowns of the users of our consultation services:
- Tenured or tenure-track faculty: 30.8%, with full professors being the most frequent visitors
- Non-tenure track faculty: 36.4%, with an almost even split between Lecturers and Senior Lecturers; Adjuncts, many of whom are IUB staff teaching overload classes, made up 7.8%
- Associate Instructors: 14.7%, with other grad students making up an additional 5.5%
- Miscellaneous and unknown clients could be staff members or others for whom we had no rank data.
![]()
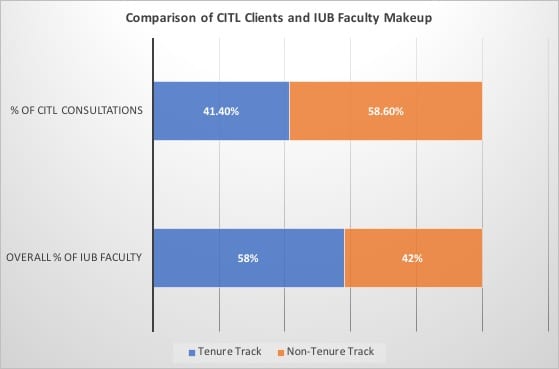
Another breakdown of just faculty consultation clients shows slightly inverted usage rates, with a greater percentage of non-tenure track clients using our consultation services than their tenure-track colleagues. In this chart, we see that tenure track faculty make up 58% of the IUB faculty (by FTE), but only 41.4% of our faculty consultation clients, while non-tenure track faculty make up only 42% of the IUB faculty but 58.6% of our consultation clientele.
What’s this all mean? For us, it means that we have a fairly healthy balance of ranks using our services, with that inverted ratio making sense, based on the more focused assignment on teaching among the non-tenure track faculty. But it also means we could do better at bringing in more tenure-track clients, whether that means providing clearer reasons to visit (e.g., support for the educational components of NSF grants) or even marketing those services better.
What else do we know?
We have analyzed our client data in numerous ways—by school, participation by year, frequency of return visits, and even tracking of new faculty cohorts over time. Some of these analyses are more practically useful than others, letting us set goals for our programming to improve our reach among the IU Bloomington faculty.
At the end of the day, though, we know that reach and impact are two different things, and our impact on teaching and learning at IUB doesn’t show through participation numbers. Instead, our impact shows when we help individual teachers measurably improve student learning, or when we partner with departments to improve their curricula in ways that enhance student retention, engagement, and success. If you have ideas for partnering with us to reach your goals, give me a call; I love crunching data, but I really appreciate the opportunity to talk to the people behind the numbers.
The data for these reports came from a self-study we did in preparation for an external review last spring semester. The data reflect a period from 2015 through 2017. Once the Spring 2019 semester concludes, we will look at more recent data for any changes or trends. If you have any questions about how we collect and use this data, contact me at gsiering@indiana.edu.
Leave a Reply