Last quarter, we ran our first round of performance and accessibility tests on OVPUE websites using Google’s Lighthouse evaluation tool and found several websites that required attention. By making minor tweaks to the settings of individual websites or the files used for images, we were able to improve quite a few websites. This week, we ran another round of performance and accessibility audits for each website in the OVPUE web portfolio.
Below is a summary of the change from last quarter in “Overall Performance”, “Accessibility”, “Best practices”, and “SEO” (search engine optimization) for each OVPUE website.
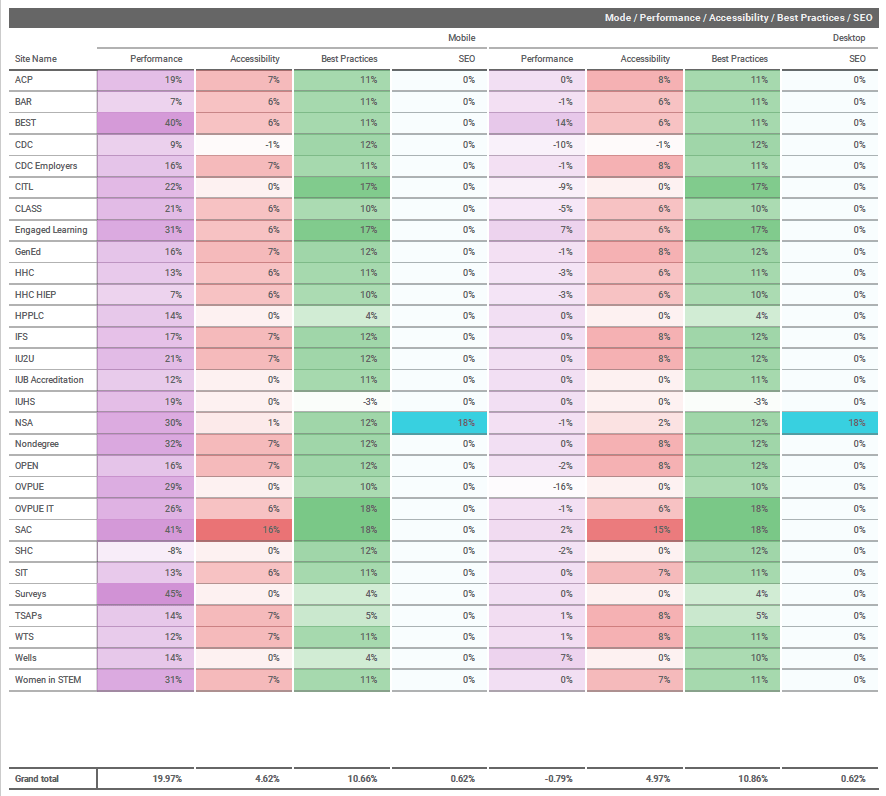
On average, “Overall Performance” on desktop increased by 19.97% and updates from IU Communications and OVPUE IT have resulted in a 10.66% increase in the “Best Practices” metric. More modest gains can be seen in all other areas with the exception of “Overall Performance” on mobile. The very minor decrease in this score could be a result of individual decisions made on a few low-scoring sites. These performance issues can now be addressed by OVPUE IT.
In addition to these overall metrics, we can compare more specific metrics like how many assets are requested by the average page load (decreased by 83%), how much data is requested overall over the network (decreased by 8-9%), and how quickly JavaScript becomes accessible (decreased by 75% on mobile).
We are looking forward to exploring this data further and identifying areas where OVPUE’s websites can improve in the future.
Leave a Reply
You must be logged in to post a comment.