by Dallas Hutchinson and Andrew Marion, IUPUI Informatics graduate students
We are interested in predicting the number of wins for each NBA team after the All-Star Break. The post-All-Star stretch is arguably one of the most important parts of an NBA Season. This is the time that each team has its final roster after the NBA trade deadline. Each team is trying to fight for playoff positioning, or “fighting” for the worst record and draft lottery positioning.
Today, 02/24/2022, is the end of the All-Star Break. We would like to build a model to predict how many wins each team will win to end the season.
All data and code can be found at either of our GitHub repositories:
This project was handled in four parts: web scraping, data cleaning, EDA, and regression modeling.
Part 1: Web Scraping
We want to pull data from the past 10 NBA seasons, starting from the 2012–13 season until the current one. The stats.nba.com page has team statistics across each season along with filters to slice the results how you wish. To scrape data from stats.nba.com, we need to identify the NBA API endpoint. This article here provides a great tutorial on how to find the endpoint within the HTML code and see the row set parameters. The function below makes a request to the NBA API for a specific endpoint based on the filters given, stores the table result set and then combines each into a data frame. A “season” column is also added to keep track of which NBA season each table is coming from.
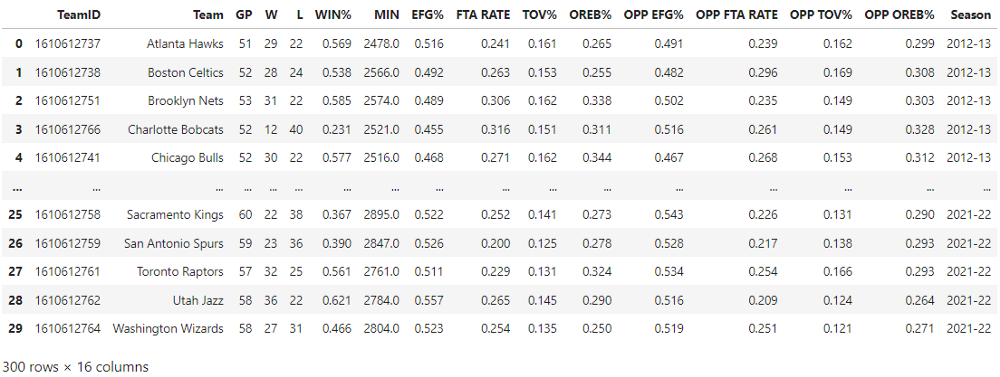
The first slice of team data we want is the Four Factors stats for each team Pre All-Star break. Four Factors stats are derived metrics focused on measuring a team’s strengths and weaknesses related to shooting, turnovers, free throws, and rebounding.

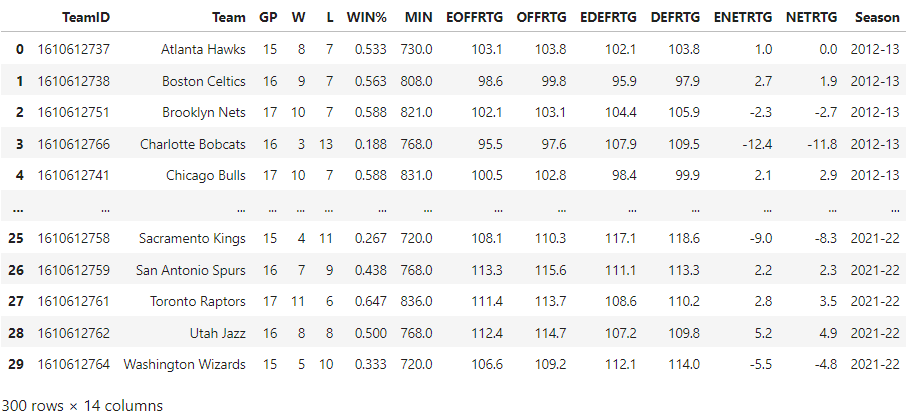
This looks right, 30 teams X 10 NBA seasons = 300 rows with the columns labeled appropriately. The next slice of data will try to capture how well a team is performing leading into the All-Star break. We will try to grab the ~15 games of metrics per team based on the date of the All-Star break that particular season. If a team is surging (or tanking) headed into the break, that will help predict how a team may perform post-break.

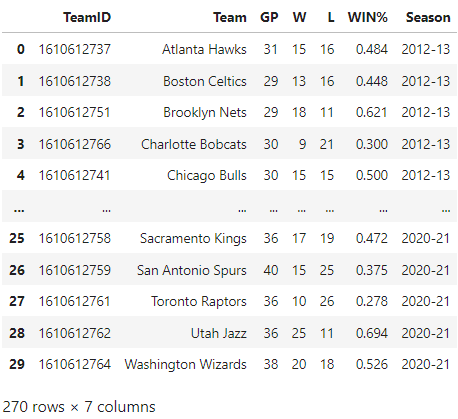
The “last_15” tables look to check out too. The final slice of data that’s needed is our actual target or outcome variable. So far we have just scraped pre-All-Star break data. But we are trying to predict post-All-Star break wins. Let’s pull some basic post-All-Star break stats including wins for the past 10 seasons (minus the ongoing season).

Looks good! 270 rows make sense since the 2021–202 season does not have any post-All-Star breaks data yet. Let’s save these three dataframes as csvs to use in the data cleaning and analysis portion. We now have two tables regarding pre-All-Star stats, one with season-to-break four factors metrics and the other with metrics for the 15-ish games heading into the break. The third table has post-All-Star break metrics from which we will extract wins to use in our regression model.
Part 2: Data Cleaning
We will first read in our three csv files as dataframes using pandas. For each dataframe we will check and validate the column data types, null values in each column, and season counts. Everything seems to look as expected. Then, we drop unnecessary columns and rename a few others for more clear interpretation.
To combine the tables, we’ll use pd.merge twice utilizing an inner join on the “Team” and “Season” columns. Before the second merge, the last 30 rows of the dataframe corresponding to the current 2021–2022 season will be split off and saved as itself. This “curr_season” dataframe will be used at the end to make predictions on how many wins teams this season will have.
Part 3: Data Exploration
When looking at our data, we noticed many highly correlated variables. We decided to drop Number of Wins (W), Number of Losses (L), Minutes Played (MIN), Number of Wins in the most recent 15 games (W_15), Number of Losses in the most recent 15 games (L_15) from the model, as they have too highly correlated with other variables in the model.
Looking at the distribution of the remaining variables, no variables stood out enough to be removed from the model. However, we found that the previous two seasons (2019–2020 and 2020–2021) season added variation in the data that may cause an issue with our predictions, as they both had fewer games due to the COVID-19 pandemic.
Part 4: Modeling
We decided to use a Partial Least Squares Regression, as it is especially useful when your predictors are highly collinear. In our case, many predictors we wanted to use were highly collinear.
Predictor Variables: Games Played (GP), Win Percentage (WIN%), Expected Field Goal Percentage (EFG%), Free Throw Rate (FTA RATE), Turnover Percentage (TOV%), Offensive Rebounding Percentage (OREB%), Opponent Expected Field Goal Percentage (OPP EFG%), Opponent Free Throw Rate (OPP FTA RATE), Opponent Turnover Percentage (OPP TOV%), Opponent Offensive Rebounding Percentage (OPP OREB%), Games Played for the previous month (GP_15), Win Percentage for the previous month (WIN%_15), Offensive Rating for the previous month (OFFRTG_15), Defensive Rating for the previous month (DEFRTG_15), Net Rating for the previous month (NETRTG_15)
Outcome Variable: Win’s Post All-Star Break
Our model was built using Partial Least Squares Regression and Cross-Validation to make the best fitting model. Next, we optimized our model by testing the number of variables in our model to minimize the Mean Squared Error (MSE) and maximize the R Squared (R2). Our plots of the MSE and R2 are used to check that our model is working effectively. Finally, we plotted our regression line vs the expected regression line (y vs y) to compare our model to the theoretical best model.
Partial Least Square using the past 9 seasons:
In the model, the optimal number of variables left in the model was found to be only 3 variables, leaving us with an R2 = 0.5113 and an MSE = 14.9085. This means that based on our model, it predicts it will be off on average 3.8612 wins.
Partial Least Square not using the previous 2 seasons (2019–2020 and 2020–2021):
As we noted earlier, there are two seasons affected by the COVID-19 pandemic, 2019–2020 and 2020–2021. We decided to remove those seasons from the model to see if they are affecting it.
In the model, the optimal number of variables left in the model was found to be 6 variables, leaving us with an R2 = 0.5782 and an MSE = 10.5266. This means that based on our model, it predicts it will be off on average 3.2445 wins.
Part 5: Findings
Not using the previous 2 seasons (2019–2020 and 2020–2021) helped improve our model, as this year is expected to be more of a typical year in terms of games played after the All-Star Break. With this PLS model trained on 7 NBA seasons of data, we are ideally able to predict post-All-Star break wins within ~3 wins. Let’s try it out.
Part 6: Predictions

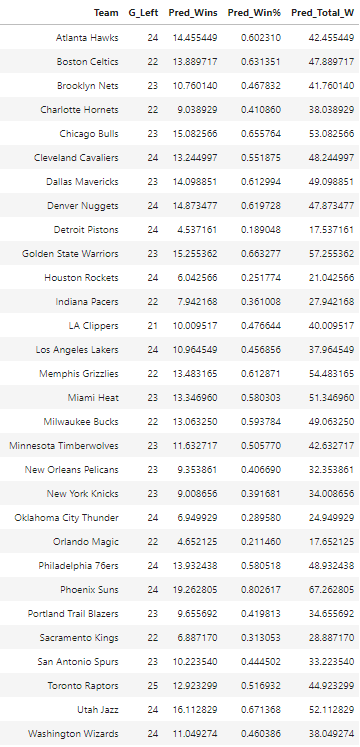
Key: Team (NBA Team Name), G_left (number of games left in the season), pred_wins (the team’s predicted number of wins in their remaining games), Pred_Win% (the team’s predicted win percentage for their remaining games), Pred_Total_W (the team’s current number of wins + predicted wins)

Leave a Reply