by Aydan Koyles, IUPUI Informatics graduate student
At every level of football, having the most talented players is often the quickest way to ensure success, and college football is no different. But yet, year after year, some teams diverge from expectations created by the level of talent on their roster. In this two part series, I will discuss five teams that have consistently underperformed expectations, and then five teams that have consistently overperformed expectations.
In this article, I will discuss five teams that have consistently underperformed expecations relative to talent. Each of these teams will have various levels of success and talent, but the underlying theme with all five is the consistent lack of meeting the expectations created by the talent on their rosters. The talent rankings are provided by 24/7 Sports and are available dating back to 2015. For this analysis, I chose to use the six seasons from 2015–2020. After obtaining this data, I chose several metrics from various sites that measure the overall success of college football teams: F+ from Football Outsiders, SP+ from ESPN’s Bill Connelly, and FPI from ESPN. To determine which value I would use in this study, I ran a regression of talent on each of those metrics and found that it was most correlated with FPI.
Once I had decided to use FPI, I used that same regression model to generate a predicted FPI value for each team in the FBS. Using the difference between the actual and predicted FPI values and the overall familiarity of each team, I selected five teams with multiple seasons of underperformance. In particular, I looked for teams that were at least 1 deviation from the mean difference score. The final five teams I selected (in alphabetical order) were Arkansas, Florida State, Nebraska, Tennessee, and UCLA. Each of these teams is part of a Power 5 conference and most have rich histories of success and even periods of dominance within college football. And yet, in the last six years, none of them have performed as would be expected given the immense levels of talent on their rosters.
To dive further into this consistent underachievement, I looked at several metrics that measure success on special teams, offense, and defense. While things like coaching turnover and dominant conference rivals may play some part, these numbers can help to explain why exactly these teams are unable to live up to the expectations we have. Below is a brief description of each metric I will use in this analysis.
STR(Special Team Rating): A composite value that encapsulates a team’s performance in all aspects of special teams(punting, kicking, and returns). Positive values indicate more success.
NFP(Net Field Position): The total difference between a team’s average starting field position and their opponent’s average starting field position. Positive values indicate more success.
Offensive PPA(Predicted Points Added): A metric that calculates the predicted amount of points each play has added. In this study, total PPA was used, so it is a sum of all plays for a given season. Larger values indicate more success.
OSR(Offensive Success Rate): The rate at which a team converts a ‘successful’ play. A successful play is defined as gaining at least 50% of yards necessary on first down, 70% of yards necessary on second down, or 100% of yards necessary on third and fourth down. Higher rates indicated more success.
OPP(Offensive Field Position Predicted Points): The amount of points, on average, predicted to be scored by a team based on their starting field position. Higher values indicated more success.
Defensive PPA(Predicted Points Added): Similarly to Offensive PPA, this metric calculates the predicted points allowed by a defense on each play and sums it over the course of the season. In this case, lower values indicate more success.
DSR(Defensive Success Rate): Similar to OSR, this is the success rate that a defense allows to the offense over the course of a season. Lower rates indicate more success in this case.
DPP(Defensive Field Position Predicted Points): Similarly to OPP, this is the average predicted points a defense gives up based on the field position for the opposing team. Lower values indicate more success.
By using a combination of offensive, defensive, and special teams metrics, I hope to gain a clearer picture of what areas teams are having the most trouble with and whether a particular phase of the game is leading to the underachievement. To analyze these metrics for each team I ran a regression model to create predicted values for each metric based on a team’s talent level and then calculated the difference between the predicted and observed values. I then looked at the deviations from the mean difference (about 0) because each difference distribution resembles a normal distribution. So lets dive into the five underperformers from the last six seasons.
Arkansas
Seasons: 2017, 2018, 2019
Talent Rank (SEC Rank): 22(9), 27(11), 26(11)
FPI Rank (SEC Rank): 69(12), 91(14), 91(13)
Arkansas is one of the teams on this list that is a little easier to understand. While they have had runs of success at various points in the last 20 years, they are often interrupted by stretches of disappointment and underachievement. A large part of this can probably be attributed to their placement in the SEC West, arguably the most difficult conference division in college football. Being forced to play teams like Alabama, LSU, Texas A&M isn’t exactly a recipe for success. And while we can see in the talent rankings above that they are consistently in the top 30 among FBS teams, because the SEC is so talented, they often finish near the bottom of their conference in talent. However, the abysmally low FPI rankings indicate more of a failure to even compete with the better teams in their conference. This team has had coaching turnover in the past and that could be attributed to some of their underachievement, but lets take a closer look at their advanced metrics to see if there are any other explanations.
Looking at the graph below, we can see the large difference between Arkansas’ predicted FPI(black) and their actual FPI(red). On average they were 13.1 units below the expectations based on their talent level.
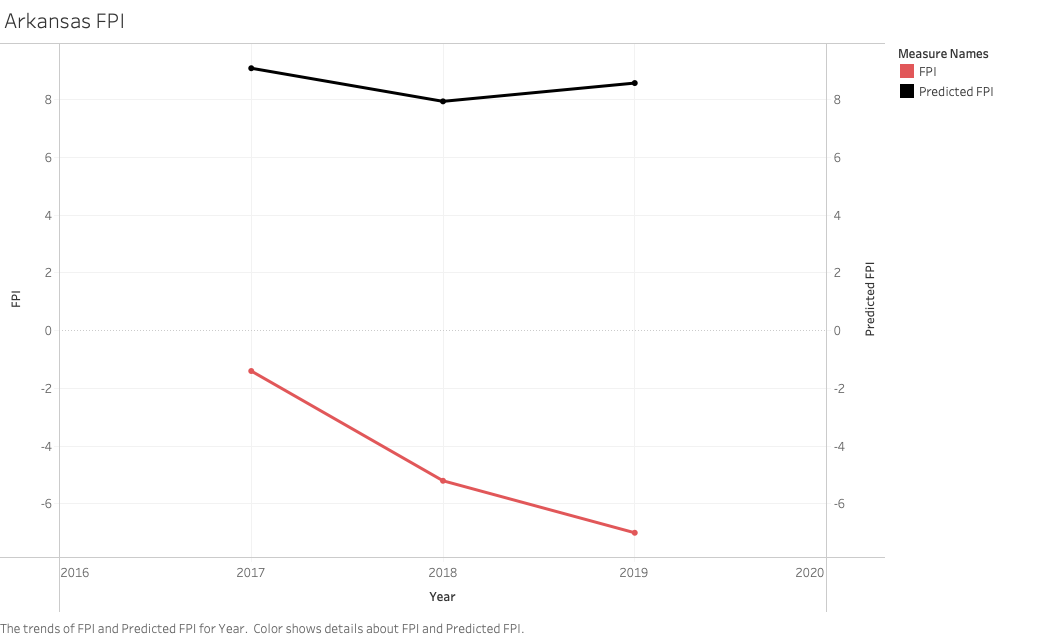
We can see that rather than getting better, things seemed to get worse between 2017 and 2019. In 2019, they had a difference of -15.6 units (1.86 standard deviations below the expected difference). This abysmal performance was the culmination of years of disappointment as they finished 2–10 with the 13th (out of 14) worst FPI in the SEC. So lets explore the three phases of the game (offense, defense and special teams) to determine why they were unable to come close to their expectations.
Special Teams
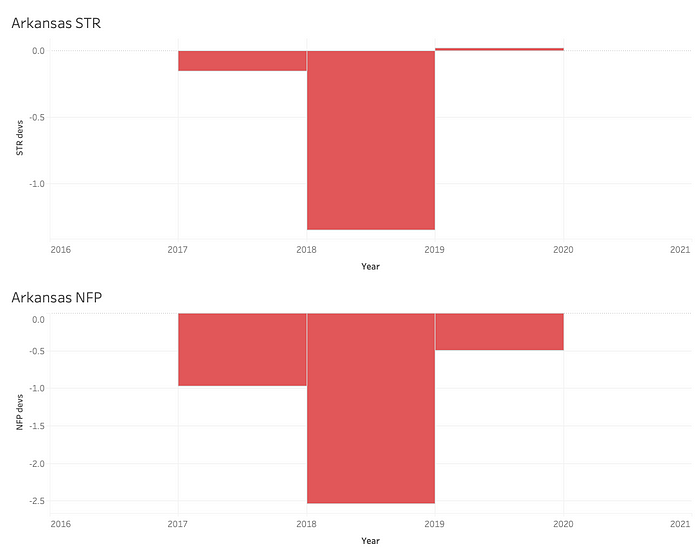
Here we can see the first indicator of Arkansas’ lack of success. Although they performed mostly around expectations in special teams, the Razorbacks consistently lost the field position battle(NFP), including a horrific year(2018) that saw them finish over 2.5 standard deviations from the expected value based on their talent.
Offense
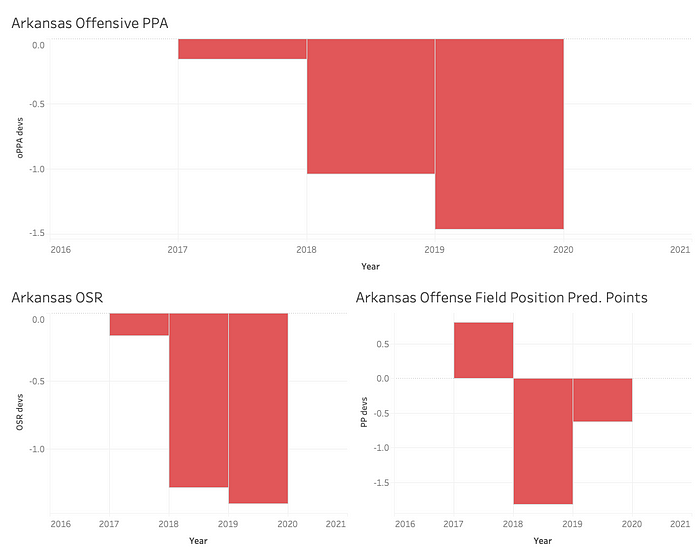
This graphic gives us further indication of why Arkansas was unable to match the success expected from their talent. The Razorback’s offense clearly was unable to match expectations and it just got worse with each passing year. They were constantly falling into long third downs and obvious passing downs (low OSR) and consistently were unable to achieve the predicted points based on their talent (low PPA). And after a positive season in the field position metric, things quickly fell apart. This means that they were unable to score points at the level we would predict based on where they were taking over the ball. This is doubly bad because as we saw in the previous section, they were also losing the field position battle.
Defense
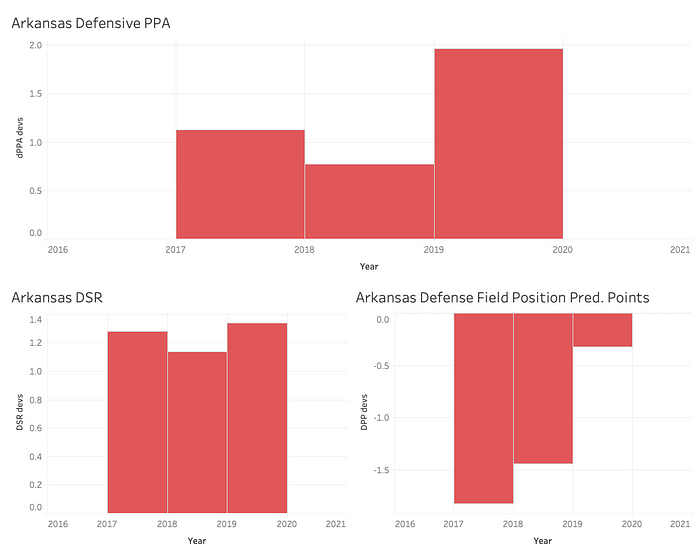
This graphic shows us Arkansas’ inability to maximize their talent on defense. Recall that for these defensive metrics, higher values are actually undesirable. Arkansas’ high deviations for PPA (as high as 2 standard deviations in 2019) indicate that they were unable to stop opposing teams from scoring as well as would be expected. In addition, their high DSR values show us they let offenses move the ball successfully down the field and were unable to force teams into long third downs (usually the quickest way to get off the field). The final graphic for predicted points based on field position does give the appearance that Arkansas’ defense was doing something right, but its important to understand the context of this metric. Although Arkansas performed well based on where opposing teams took the field, we also know that the Razorbacks were losing the field position battle, so we would expect them to give up a higher volume of points anyway.
Based on these graphics, it is clear that Arkansas struggled to meet expectations in all three phases of the game. Losing the field position battle and poor defense were the most compelling reasons, but an underperforming offense also held this team back from achieving more.
Florida State
Seasons: 2018, 2019, 2020
Talent Rank (ACC Rank): 5(1), 6(1), 16(2)
FPI Rank (ACC Rank): 67(12), 51(6), 88(11)
Florida State is a Power 5 program in a fertile recruiting bed with a rich history. They have three national championship teams and have been a consistent contender in the ACC and national picture. As recently as 2014 they were competing for a national championship and won one in 2013. But in the last few years, they have fallen off the rails. Following the 2016 season, FSU entered the year ranked third in the preseason AP poll with massive expectations. Returning QB Deandre Francois was looking to build on a promising freshman season and help lead FSU to a potential CFP berth and the chance to compete for a national championship. In a disappointing loss to Alabama in the opener, Francois was lost for the season and the team never recovered. Head coach Jimbo Fisher had one foot out the door all season and the team limped to a 7–6 finish. In the following three seasons, things only got worse as FSU continued to underperform expectations. In a matter of three years, FSU plummeted to a FPI value that ranked 88th in the FBS, which was their worst ranking since FPI began in 2005. They have gone through two coaching changes as they try to find the coach who will propel them back into the national spotlight. And yet they have had one of the most talented teams in the FBS each of those three seasons. So why have they been unable to live up to the expectations? While coaching turnover may play a part, looking at several advanced metrics may give us a clearer picture.
The graph below shows the massive underperformance from FSU over the past three seasons. We can see just how bad the underperformance was, particularly in 2018 and 2020. Florida State’s average difference for these three seasons was -16.1 units, largest among the underperformer’s seasons. Part of this has to do with the lofty expectations generated by the talent on the roster, but it also speaks to the problems FSU has had in recent years.
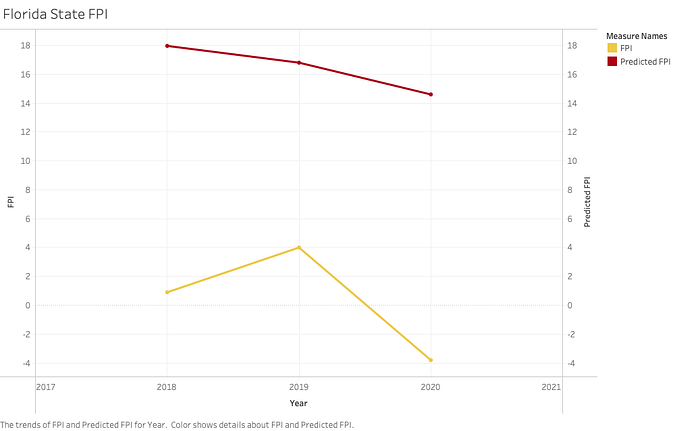
Though each of these seasons was abysmal, it reached a crisis point in 2020, as FSU posted an actual FPI of -3.8, a full 18.4 units below their expected FPI. So what went wrong? Lets dive into each of the three phases of the game to explore the problems.
Special Teams
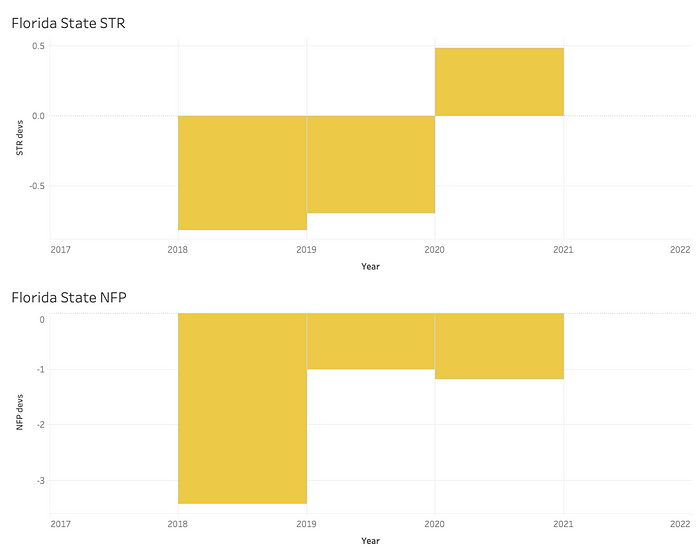
In this graphic, we can see that FSU was actually not terrible on special teams, performing relatively close to expectations in STR and actually outperforming expectations in 2020. However, looking at the NFP metric shows us some of the real problems. In 2018, they were almost 3.5 standard deviations below expectation (a ridiculously high number), and finished at least 1 standard deviation from expectation in both of the other seasons. This means Florida State was consistently losing the field position battle. The offense was being forced to go long distances to reach the endzone and the defense was inheriting very short fields. This is the first clear indicator of FSU’s lack of success.
Offense
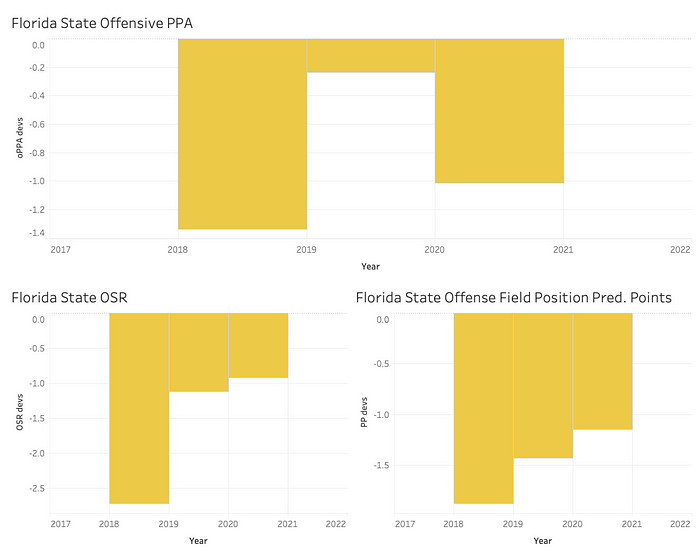
In this graphic, we can see more problems with Florida State’s inability to meet expectations. Outside of 2019(close to expected), their Offensive PPA was well below what the talent on the roster indicated it should be. This means FSU was unable to produce as many yards and points as we would have expected. In addition, they were terrible in the OSR metric (including an atrocious -2.7 standard deviations in 2018), meaning they were unable to get into manageable third downs reliably and consistently could not get first downs on any drives. Finally, we can see that they were poor in the OPP metric as well. This is doubly bad for the team because they were also losing the field position battle, so they were unable to meet expectations even though those expectations actually would have been lower. Overall, the offense was clearly a part of the problem for FSU.
Defense

Finally we look at the graphic for the defensive side of the ball. This phase of the game is not nearly as egregious as the offense, although it still tended to underperform. In particular, the defense took major steps back in 2020, with a massive underperformance in DSR. This means that opposing team’s were able to easily pick up the yards needed on every down(which the offense was unable to do for FSU). This would have had a compounding effect on the offensive and field position struggles, making things even worse. Though the final graphic looks surprising(they actually outperformed expectations in DPP), they were already losing the field position battle, so expectations would have been very low(particularly in 2018). Though the defense is not the worst problem, it is still part of the problem for Florida State.
This analysis showed the myriad problems FSU has dealt with in the last few seasons. With the offense being abysmal and the defense not helping much, FSU reached new lows as a program.
Nebraska
Seasons: 2017
Talent Rank (Big 10 Rank): 29(5)
FPI Rank (Big 10 Rank): 70(11)
Nebraska is another team with a rich history of success, including 5 national championship titles. And while their last title came in 1997, they still were a competitive program through most of this past 20 years. Though only one of their seasons fell more than 1 full standard deviation from the mean difference, they have underperformed in each of the last six seasons. They have also dealt with coaching changes in the last few years, but have been even less competitive than would be expected, particularly given the talent on their roster from year to year. A look at the advanced metrics should help to explain their consistent underperformance.
Though Nebraska underperformed in each of these six seasons, only one of those seasons was more than 1 standard deviation worse than expectation. The graph below shows the difference between their expected and actual FPI for that 2017 season.
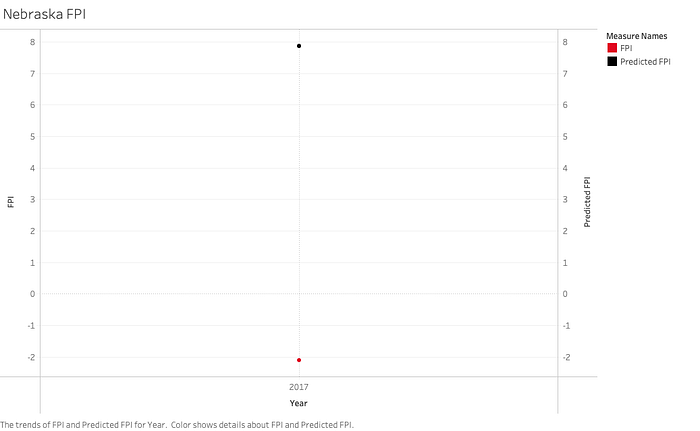
In 2017, Nebraska finished with an FPI of -2.1, which was 10 units below expectation. So what went wrong that year? Lets look at the numbers for each phase of the game to find out.
Special Teams
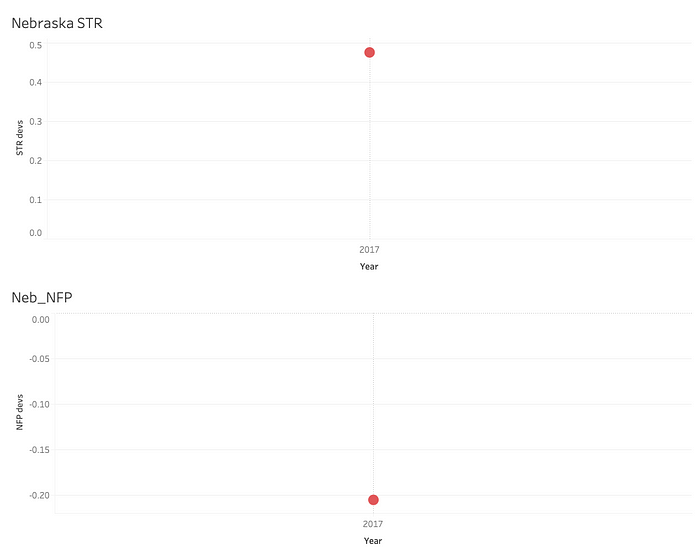
For these two metrics, we can see that Nebraska actually performed close to(or above) expectations, so clearly the special teams unit wasn’t a huge problem for them. Their STR metric was actually above expectations, meaning the special teams unit as a whole was a benefit to the team in 2017.
Offense
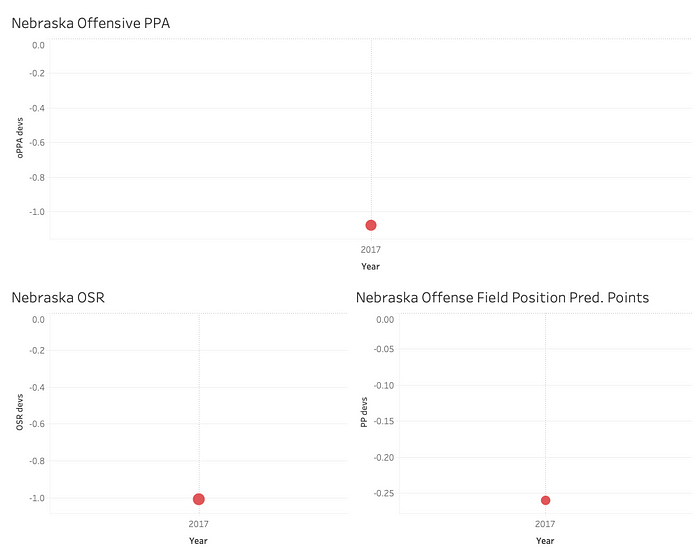
Here we can see the first sign of issues for Nebraska. In both Offensive PPA and OSR they were approximately 1 standard deviation below expectation. This means they struggled to move the ball effectively, consistently having short, unfruitful drives and putting their defense on the field more often. They were closer to expectations in the field position metric, but still underperformed slightly.
Defense
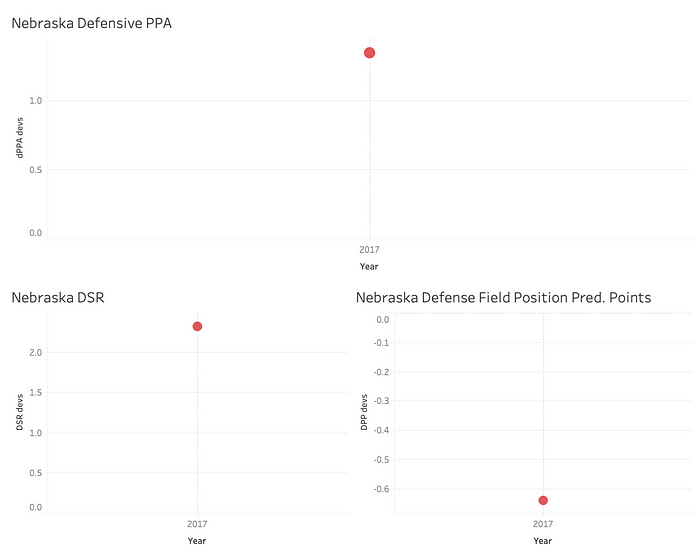
Here we can see the real problem for Nebraska in 2017. Other than the field position metric (more on that later), Nebraska underperformed expectations by well over 1 standard deviation in both Defensive PPA(1.34 deviations) and DSR(2.32 deviations). This means the defense struggled to get off the field and gave up chunks of yardage consistently. While they did actually outperform slightly in DPP, it was not by much and they also slightly underperfomed in NFP, which heavily impacts the field position metrics. Overall, we can say that the defense was most likely Nebraska’s biggest problem in 2017.
Based on these results we can see that the defense was the biggest problem for Nebraska, although the offense certainly was not much better. Although special teams performed relatively well, it was not nearly enough to bolster Nebraska in 2017.
Tennessee
Seasons: 2017, 2018, 2020
Talent Rank (SEC Rank): 12(5), 15(6), 15(7)
FPI Rank (SEC Rank): 73(13), 65(13), 53(11)
Another team with a lot of history and success is Tennessee, who has claimed 6 national championships, including one in 1998. In fact, as recently as the late 90s and early 2000s, Tennessee was one of the premier programs in the SEC. Yet even though their talent pool has remained largely intact, the program has faltered in recent years and struggles to compete with the other talented programs in the SEC. Yet again, we can see that coaching changes may have played some part (a common theme in this article) but looking at advanced metrics will provide more evidence for why they have been unable to recreate the success they have so often enjoyed in their history.
Looking at the graph below, we can see the differences between expected and actual FPI for Tennessee in their three worst underperforming seasons.
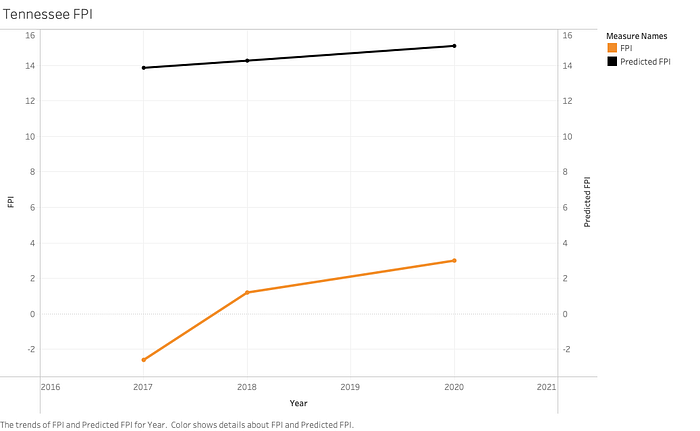
We can see that after a horrible underperformance in 2017, Tennessee gradually improved, although they were unable to close the gap on their expected FPI too much. Their difference of -16.5 units in 2017 was almost 2 standard deviations below the expectation. So what was the problem for Tennessee? Lets dive into the numbers for each of the three phases of the game to find out.
Special Teams
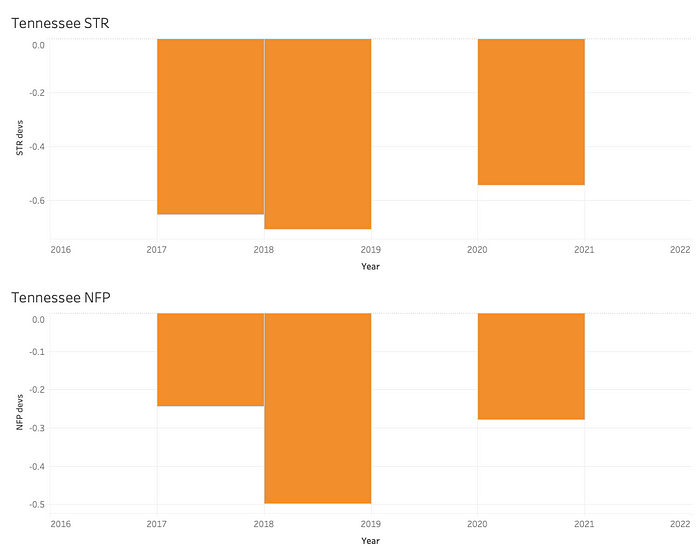
In this graphic we can see minor underperformance for Tennessee’s special teams unit. Although in underperformed in both metrics all three of these seasons, none of those seasons were too far from the expectation, with the lowest standard deviation value being -0.7. So while the special teams certainly wasn’t a cause for great success, it doesn’t appear to be the main culprit of underperformance in Tennessee.
Offense

In this graphic, we start to see more of the main issues for the Volunteers. Severe underperformances in both Offensive PPA and OSR meant the offense was unable to consistently move the chains and score points, meaning the defense had more work to do and was on the field a lot. And for opposing teams, the defense got plenty of rest as Tennessee faced many short drives. While the OPP metric is less convincing, we know they were already losing the field position battle slightly (low NFP) and clearly they were unable to meet those expectations in later seasons(2018 and 2020).
Defense
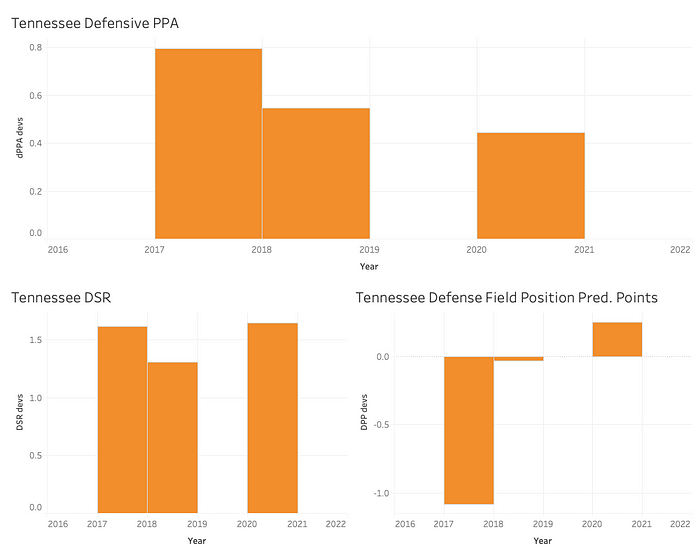
Here we can see more problems for Tennessee. Although they actually performed somewhat close to expectations in Defensive PPA, they were unable to perform well in DSR. This means that opposing offenses were able to move the ball consistently and keep the defense on the field for longer. Although the DPP metric actually indicates that Tennessee was meeting(or even exceeding) expectations, we know from above that they were already losing the field position battle, so this metric is impacted by that.
Overall, it is clear to see that Tennessee’s problem is less about one aspect of the team and more about all phases slightly underperforming. Though none of the units were well below expectations, the combination of all three performing below average led to Tennessee’s inability to meet expectations.
UCLA
Seasons: 2017, 2018, 2019
Talent Rank (PAC 12 Rank): 11(2), 19(3), 22(5)
FPI Rank (PAC 12 Rank): 45(8), 68(10), 58(8)
UCLA is perhaps better known for the success of its basketball teams, but the football team has had its share of success. Often overshadowed by its neighbor school USC, the UCLA program still has a national title to its resume as well as a history of success. But in recent years, that success has mostly vanished. After an incredibly disappointing season in 2017 (given the level of talent on the roster), the Bruins hired Chip Kelly in an effort to revitalize the program. However, as of 2020, UCLA had not finished at or above .500 in any of his seasons as coach. So lets take a look at the numbers to see if we can find some of the issues to blame for this underachievement.
In this graph we can see the difference between UCLA’s expected and actual FPI values for 2017–2019 (their three most disappointing seasons). It is also worth noting the precipitous drop in predicted FPI over those three seasons (indicating an exodus of talent from the roster) and the continued drop in actual FPI.
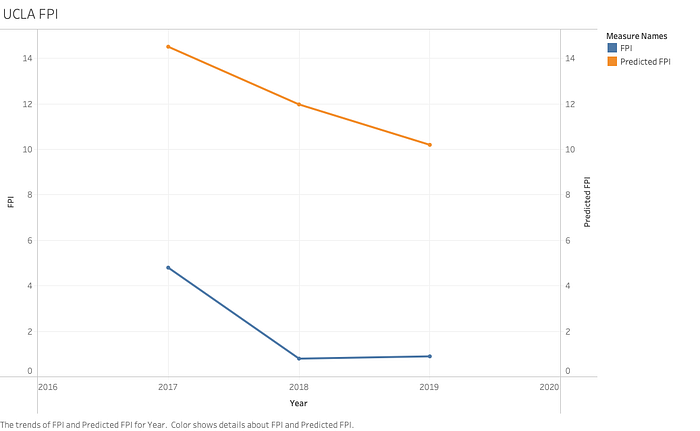
Although 2017 saw their best FPI value for these three seasons, it was also their highest expectation year. But in 2018, despite a drop in talent, UCLA underperformed even more, finishing 11.2 units below expectations. Overall, for these three seasons UCLA was generally about 10 units below the expectations generated by their talent. So what was the problem? Lets explore each phase of the game to gain a clearer picture of what went wrong.
Special Teams
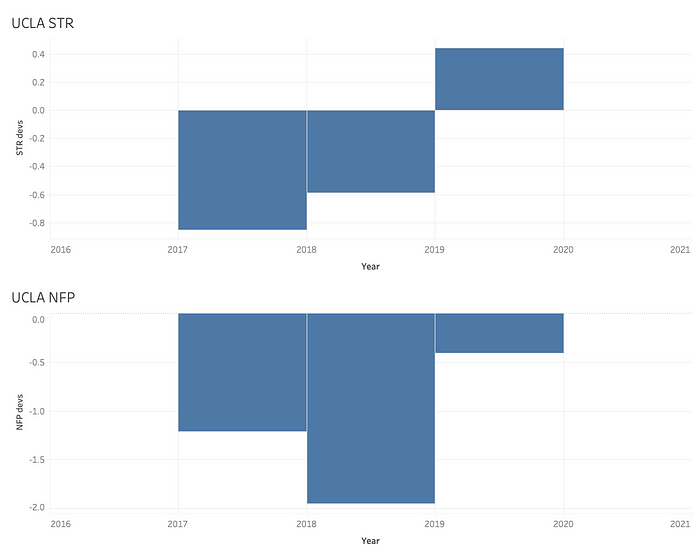
Here we can see the first indicators of underperformance. Although the special teams unit as a whole managed to perform close to expectations(STR), UCLA consistently lost the field position battle (low NFP). This means UCLA generally had to start drives deep in their own territory and opposing teams took over with a short field to work with. So while the special teams didn’t seem to be hurting UCLA, losing the field position battle is an easy way to put a team behind no matter how much talent is on the field.
Offense
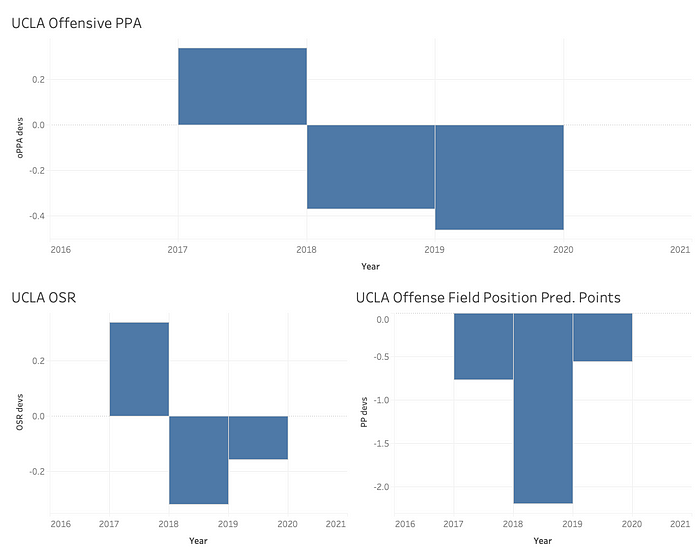
In this graphic we see that the offense probably wasn’t UCLA’s biggest problem. Although they did perform poorly in the field position metric (bottom right), they essentially met expectations in both Offensive PPA and OSR. So while the offense wasn’t exactly great, it doesn’t seem to be the main issue either.
Defense
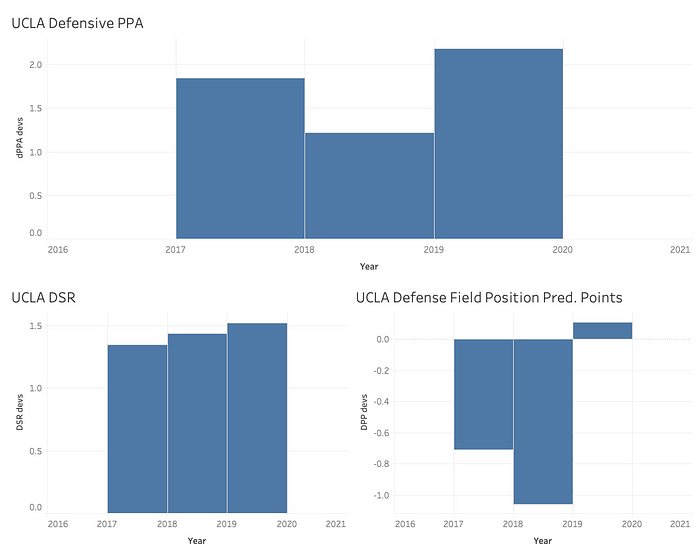
Here we can finally see the biggest problem for these UCLA teams: defense. UCLA consistently finished more than 1.5 standard deviations below expectation in defensive PPA, meaning opposing teams moved the ball and scored points with much more ease than was expected based on the talent UCLA fielded each year. And in DSR, UCLA was between 1 and 1.5 standard deviations worse than expected, which means opposing offenses had success moving the chains and staying on schedule. While UCLA did perform reasonably well in the field position metric, we know that they lost the field position battle consistently, so teams were taking over with really good field position often(creating lower expectations for that metric). Overall, it is clear that the defense was the main culprit of underperformance for UCLA.
This analysis helped us discover the problems for UCLA in the last few seasons. A combination of dreadful defense and below average offense and special teams provided the main issues for an underachieving UCLA team.
This study explored some of the driving reasons behind underperformance among some of the most talented college football programs. And it provides a clear lesson to the juggernauts of college football: having the most talent isn’t necessarily a one-way ticket to success.

Leave a Reply