
by Aydan Koyles, IUPUI Informatics graduate student
At every level of football, having the most talented players is often the quickest way to ensure success, and college football is no different. But yet, year after year, some teams diverge from expectations created by the level of talent on their roster. In this two part series, I will discuss five teams that have consistently underperformed expectations, and then five teams that have consistently overperformed expectations.
For this article, I will discuss five teams that have consistently overperformed expectations relative to talent. Each of these teams will have various levels of success and talent, but the underlying theme with all five is the consistent ability to perform better than expected. The talent rankings are provided by 24/7 Sports and are available dating back to 2015. For this analysis, I chose to use the six seasons from 2015–2020. After obtaining this data, I chose several metrics from various sites that measure the overall success of college football teams: F+ from Football Outsiders, SP+ from ESPN’s Bill Connelly, and FPI from ESPN. To determine which value I would use in this study, I ran a regression of talent on each of those metrics and found that it was most correlated with FPI.
Once I had decided to use FPI, I used that same regression model to generate a predicted FPI value for each team in the FBS. Using the difference between the actual and predicted FPI values and the overall familiarity of each team, I selected five teams with multiple seasons of overperformance. In particular, I looked for teams that were at least 1 deviation from the mean difference score. The final five teams I selected (in alphabetical order) were Appalachian State, Iowa State, Memphis, UCF, and Wisconsin.
To dive further into this consistent underachievement, I looked at several metrics that measure success on special teams, offense, and defense. While things like coaching ability and weaker conferences may play a part, an advanced analysis may give a clearer picture of each teams consistent ability to overperform. Below is a brief description of each metric I will use in this analysis.
STR(Special Team Rating): A composite value that encapsulates a team’s performance in all aspects of special teams(punting, kicking, and returns). Positive values indicate more success.
NFP(Net Field Position): The total difference between a team’s average starting field position and their opponent’s average starting field position. Positive values indicate more success.
Offensive PPA(Predicted Points Added): A metric that calculates the predicted amount of points each play has added. In this study, total PPA was used, so it is a sum of all plays for a given season. Larger values indicate more success.
OSR(Offensive Success Rate): The rate at which a team converts a ‘successful’ play. A successful play is defined as gaining at least 50% of yards necessary on first down, 70% of yards necessary on second down, or 100% of yards necessary on third and fourth down. Higher rates indicated more success.
OPP(Offensive Field Position Predicted Points): The amount of points, on average, predicted to be scored by a team based on their starting field position. Higher values indicated more success.
Defensive PPA(Predicted Points Added): Similarly to Offensive PPA, this metric calculates the predicted points allowed by a defense on each play and sums it over the course of the season. In this case, lower values indicate more success.
DSR(Defensive Success Rate): Similar to OSR, this is the success rate that a defense allows to the offense over the course of a season. Lower rates indicate more success in this case.
DPP(Defensive Field Position Predicted Points): Similarly to OPP, this is the average predicted points a defense gives up based on the field position for the opposing team. Lower values indicate more success.
By using a combination of offensive, defensive, and special teams metrics, I hope to gain a clearer picture of what areas teams are maximizing to outperform expectations and win football games. To analyze these metrics for each team I ran a regression model to create predicted values for each metric based on a team’s talent level and then calculated the difference between the predicted and observed values. I then looked at the deviations from the mean difference (about 0) because each difference distribution resembles a normal distribution. So lets dive into the five overperformers from the last six seasons.
Appalachian State
Seasons: 2015, 2016, 2017, 2018, 2019, 2020
Talent Rank (Sun Belt Rank): 120(8), 119(7), 118(6), 110(6), 101(2), 93(1)
FPI Rank (Sun Belt Rank): 57(2), 54(1), 63(1), 45(1), 29(1), 39(3)
Appalachian State is perhaps most famous for its huge upset of then No. 5 Michigan in 2007, but that was merely a part of their impressive run in the FCS as they won 3 national championships at that level before making the jump to FBS. Though many teams struggle to make that leap and immediately compete, Appalachian State has been good from the start, consistently overperforming their talent level. And in each of the last 5 seasons (2016–2020) they have won their bowl game. In the last couple of seasons, they have performed well despite coaching turnover. And they have continued to improve each season. So perhaps a look at the advanced numbers will help us understand why they have continued to exceed expectations.
The graph below shows the predicted FPI(black) and actual FPI(yellow) for each season included in this study. It is easy to see the vast difference between their expected and actual FPI values.
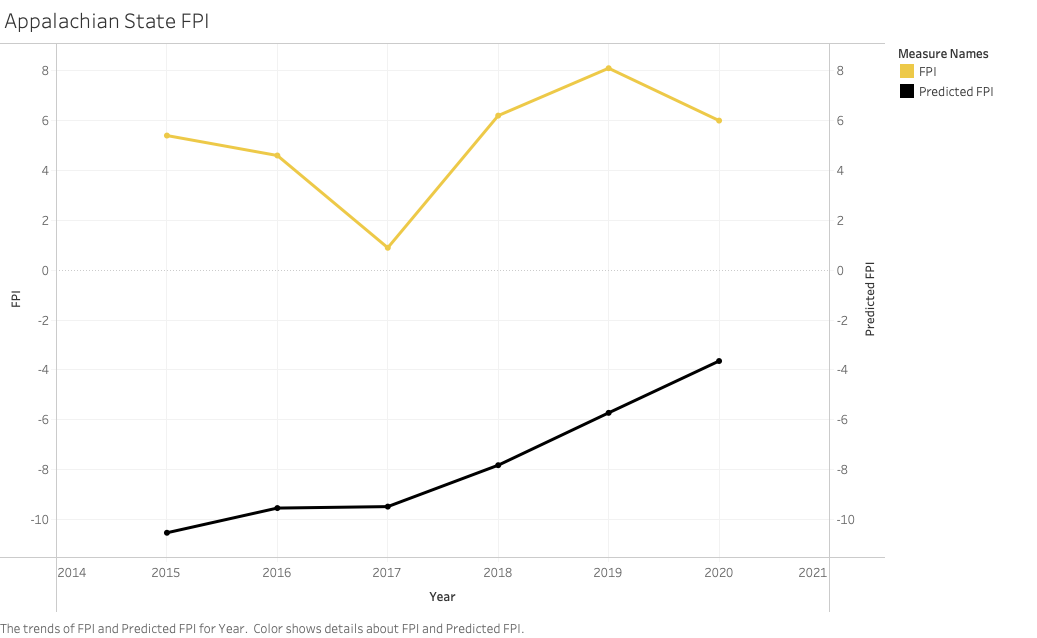
The average mean difference for their FPI value was 12.99, or about 1.5 deviations from the mean. Perhaps the most impressive part is the remarkable consistency: each season except 2020 they had a difference greater than 10.
So lets look at the three phases of the game to see where the success is coming from.
Special Teams
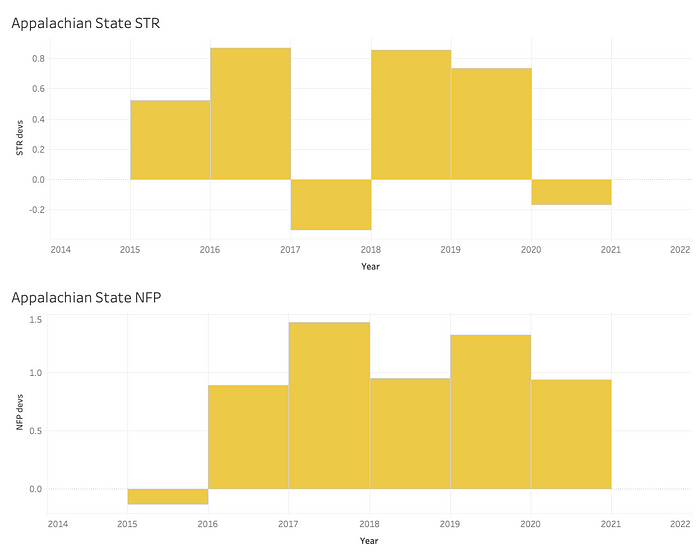

Looking at this graph, we can see that the Mountaineers had STR and NFP values that were generally positively deviated from the mean. In particular, they had much higher NFP values than we could have expected. This is important because it means they were consistently winning the field position battle, which is an easy way to get an advantage against teams with more talent. And the positive STR values means that in general, they have been very good on special teams. Overall, it is clear that the special teams unit has been a big part of the success Appalachian State has enjoyed in recent years.
Offense
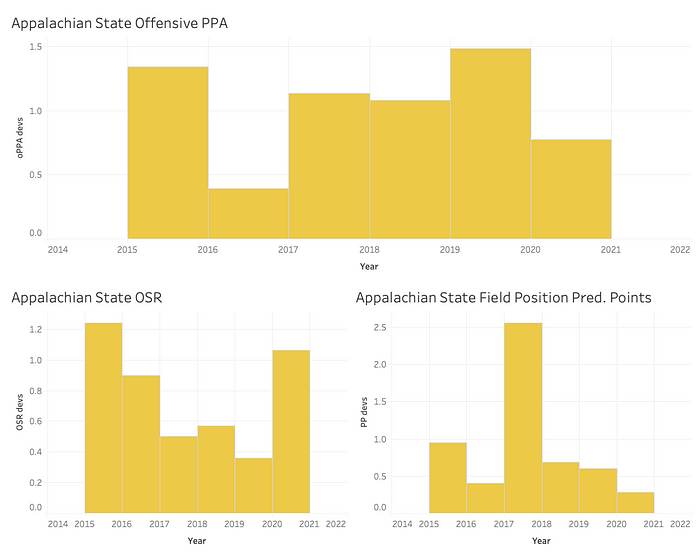
The above dashboard shows us 3 key offensive metrics and how much Appalachian State was able to outperform those metrics relative to their expectations. As we can see, they were consistently more than one standard deviation better than expected in offensive PPA. This means that on a play-by-play basis, they were able to exceed the number of points we would predict them to score. In addition, their OSR values were higher than expected, meaning the Mountaineers often stayed ahead of the sticks and avoided long third downs. Finally, we can see that their predicted points based on field position also exceeded expectations, meaning they were able to capitalize on field position even more than expected. If you recall from the special teams section above, Appalachian State was also consistently winning the field position battle, meaning that they were able to combine these two efficiencies into greater success.
Defense
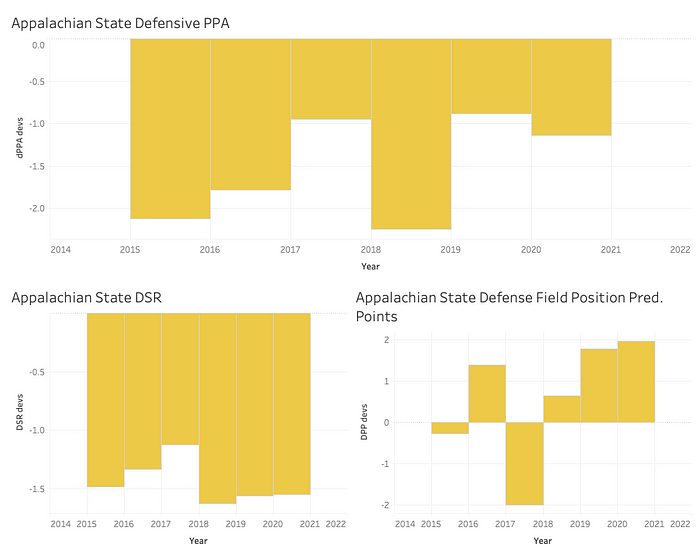
The defensive dashboard (mostly) shows us what we would expect to see. In fact, based on the top graphic, it appears that the defense may have been even more responsible for the team’s success. On average, the Mountaineers were about 0.5 deviations better against expectations on defense than on offense (1.52 vs. 1.03). They were also consistently much better than expected in defensive success rate, meaning they forced opponents into more long third downs giving them an advantage. Curiously, their predicted points allowed based on defensive field position has been worse than expected. However, since we know they were winning the field position battle and capitalizing on this metric on offense this doesn’t appear to be as concerning.
Based on this analysis, its easy to see why Appalachian State has outperformed expectations so consistently. Despite a low level of talent and recent move to the FBS, Appalachian State has put together several impressive seasons by exceeding expectations in all facets of the game. In particular, their defense and special teams units have been exceptional, allowing the Mountaineers to overperform each of the last six seasons.
Iowa State
Seasons: 2017, 2020
Talent Rank (Big 12 Rank): 56(8), 57(8)
FPI Rank (Big 12 Rank): 26(5), 10(3)
Iowa State has typically been a mediocre to bad team, having never won 10 games in a season and only finishing in the top 25 three times in their history. But in the last few years, new coach Matt Campbell has led them to national prominence, including a program-best No. 9 finish in the AP poll in 2020. All of this has been in spite of a fairly low talent level and playing in a Power 5 conference (Big 12). While Campbell and the coaching staff may be part of the reason for this success, lets dive into the numbers that explain why they have been so successful in recent seasons.
In the graph below, we can see just how much Iowa State was able to outperform expectations in these two seasons (they outperformed in each season, these two were the only in which they outperformed by more than 1 standard deviation).
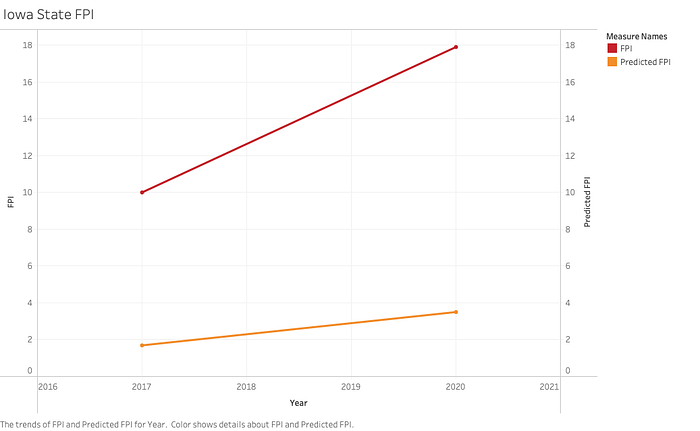
In particular, 2020 was a huge year for the Cyclones. Their expected FPI was 3.5, while they achieved an FPI of 17.9. This difference of 14.4 was 1.72 deviations above expectation. Clearly Iowa State was able to overcome a fairly low talent pool to achieve (probably) the greatest season in school history. Lets look at how they did in each phase of the game to understand this a little better.
Special Teams
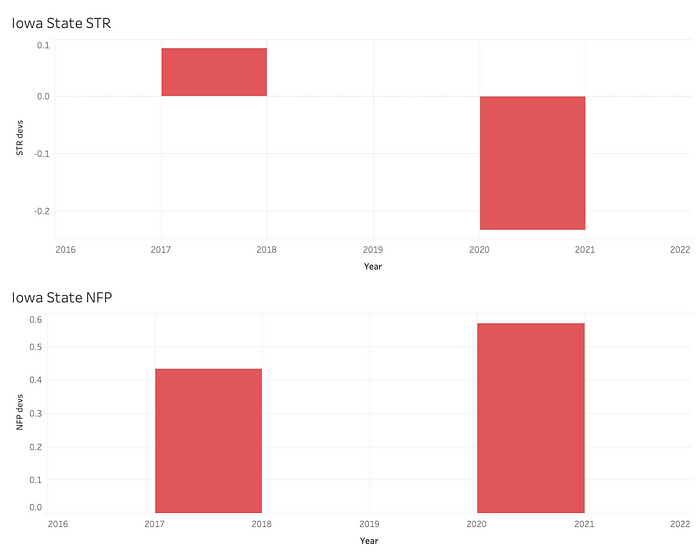
In this graphic, we can see that Iowa State clearly won the field position battle in both of their outperforming seasons. This would have allowed them to take advantage of good field position on offense and given their defense a better chance to stop opposing teams. However, their special teams rating was actually lower than expected in 2020 so we may be able to rule out special teams as a general cause for their success.
Offense
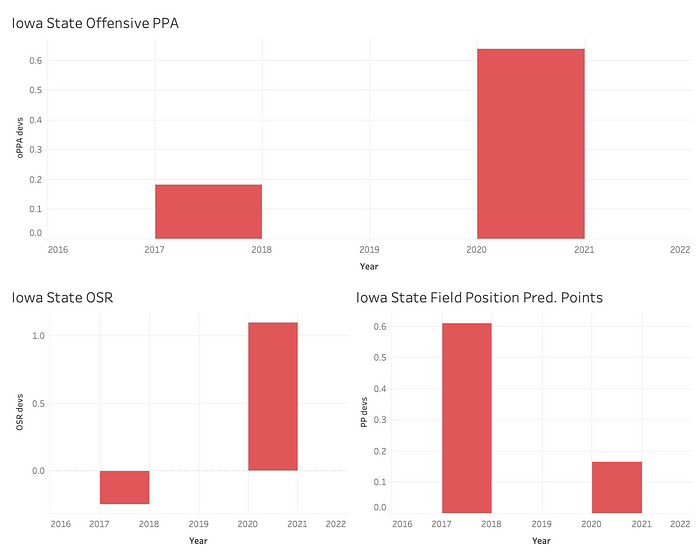
In this graphic, we can see that in 2020 Iowa State was able to outperform expectations considerably in both Offensive PPA and OSR. This means they were able to stay ahead of the sticks and were better than predicted on a per-play basis. However, we can see that across both seasons these results are less consistent and perhaps the offense is not an indicator of their consistent success.
Defense
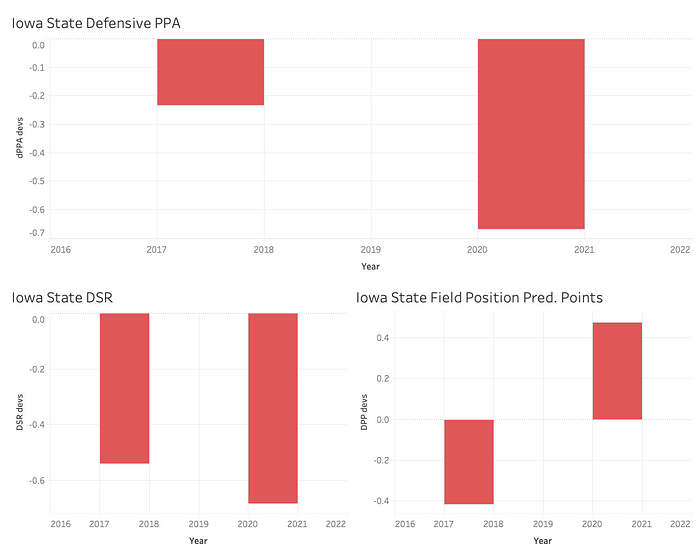
In this graphic we can see the best indicator of why Iowa State has been able to outperform expectations consistently. While the Field Position Predicted Points metric is less indicative, the other two show that Iowa State consistently limits their opponents’ ability to move the ball effectively.
These graphics show that the greatest reasons for Iowa State’s success has been their ability to win the field position battle and play solid defense. While the offense has had its moments, the defense has been more consistent. And although they performed well in the NFP metric, they have merely survived an average to below-average special teams unit.
Memphis
Seasons: 2015, 2016, 2017, 2019
Talent Rank (AAC Rank): 96(11), 79(7), 70(4), 71(6)
FPI Rank (AAC Rank): 46(3), 52(5), 30(2), 24(2)
For almost all of the Tigers history they have been mostly disappointing, with very few winning seasons and having appeared in the AP poll only six times (5 of which occurred within the last seven seasons). But in the last few years, Memphis has transformed itself into an annual bowl team and contender for the American conference title. And while they do play in a lower tier conference, it is often considered the most competitive non-Power 5 conference in college football. They have also continued their success despite several coaching changes. So lets look at the numbers that explain why they have had so much success recently.
The following graph shows the disparity between their expected FPI (black) and their actual FPI (blue). In particular, we can see that in 2015 Memphis was able to outperform their expected FPI by 14.9 units (1.78 deviations).
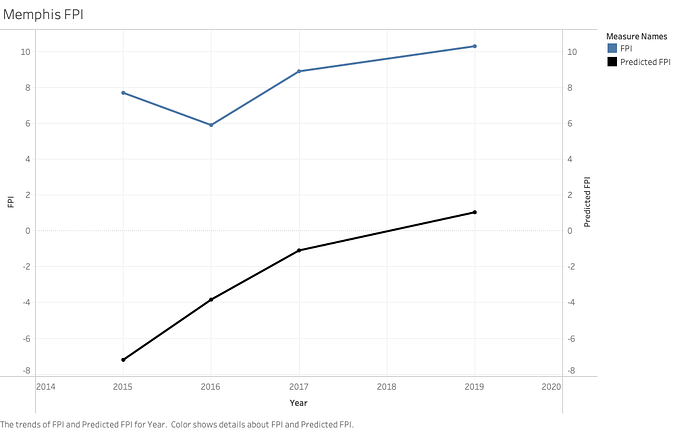
Overall, Memphis averaged a difference of 10.97 units for these 4 seasons, an incredible amount of consistency. Even if you include 2018 and 2020 (seasons in which they outperformed but not as much), the average is still about 8 units. Clearly, Memphis has proven in the last few seasons that talent isn’t everything. So which of three phases can explain this overperformance?
Special Teams

Here we can see that Memphis’ special teams units have been a huge part of their success. In the top graphic, we can see that in each of their seasons, the Tigers’ STR difference has been at least 1 standard deviation above the mean. This consistency on special teams allows Memphis to take advantage of every opportunity and match up better with more talented teams. Although it is not as impressive, Memphis has also won the field position battle in each of their overperforming seasons. In particular, 2015 and 2016 (their highest overperformance scores) they finished well above 1 standard deviation from the mean difference.
Offense
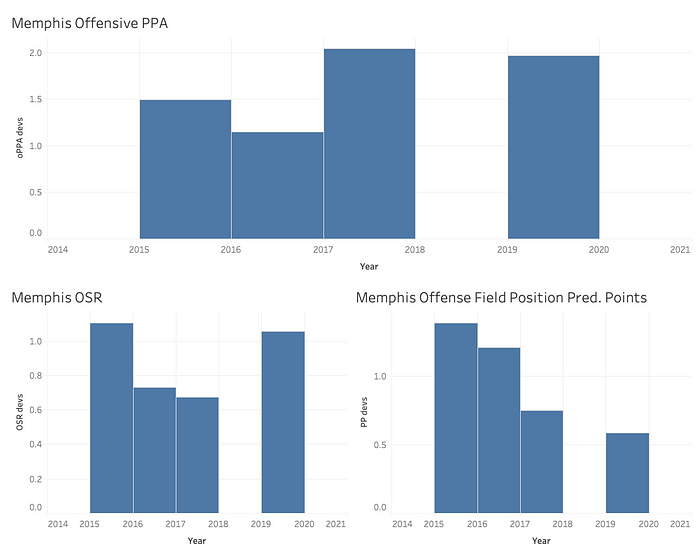
In this graphic, we can see just how successful Memphis’ offense has been. Their PPA value on offense has consistently outperformed by 1.5–2 standard deviations, an incredibly high number. The Tigers’ OSR and field position predicted points metrics have also consistently been above expectations. This means Memphis was able to maximize their opportunities on every play and consistently stay ahead of the chains. They also managed to defy the odds no matter where the offense took over on the field, consistently putting points on the board even when they had bad field position.
Defense
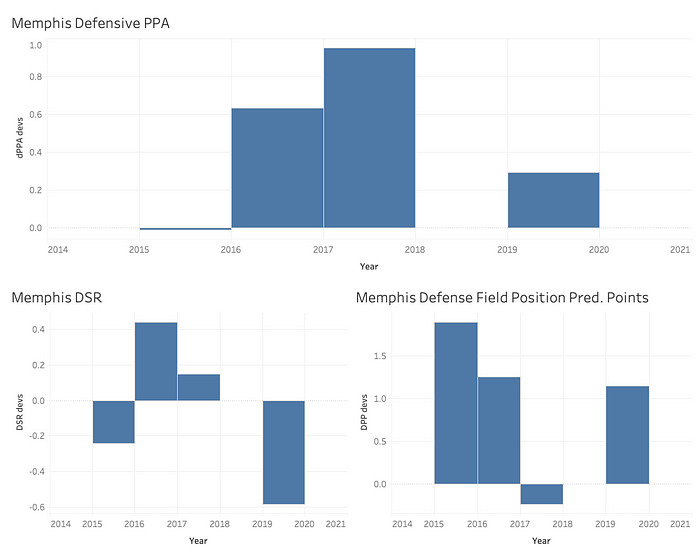
In this graphic, we can see the only phase of the game where Memphis has not outperformed expectations(recall that positive values are an indicator of less success for defensive metrics). Although Memphis had a couple of random instances where they outperformed various defensive metrics, its clear that the defense has lacked consistency and has been more of a problem when it comes to their success.
Based on this analysis, its clear that Memphis has used an electric offense and solid special teams’ play to compete with more talented programs and elevate themselves above what we would expect. They have been able to outperform expectations despite a below-average defense that actually fails to meet expectations in most seasons.
UCF
Seasons: 2017, 2018, 2019, 2020
Talent Rank (AAC Rank): 55(1), 56(2), 54(1), 60(3)
FPI Rank (AAC Rank): 15(1), 25(1), 21(1), 22(2)
UCF has only been in the FBS since 1996 and up until a few years ago was fairly irrelevant in the college football landscape. In fact, as recently as 2015, UCF finished 0–12. But something has changed in the last several years. In 2017, just two years after the winless campaign, UCF finished 13–0 and 15th in the FPI rankings(claiming that they should be national champions in the process). This abrupt turnaround and continued success has far exceeded the level of talent on the roster. Though Scott Frost brought them the initial success, they have managed to continue despite coaching turnover after he departed. Looking at UCF’s advanced metrics will help explain this recent success.
In the graph below we can see the difference between their expected and actual FPI values and how impressive they have truly been.
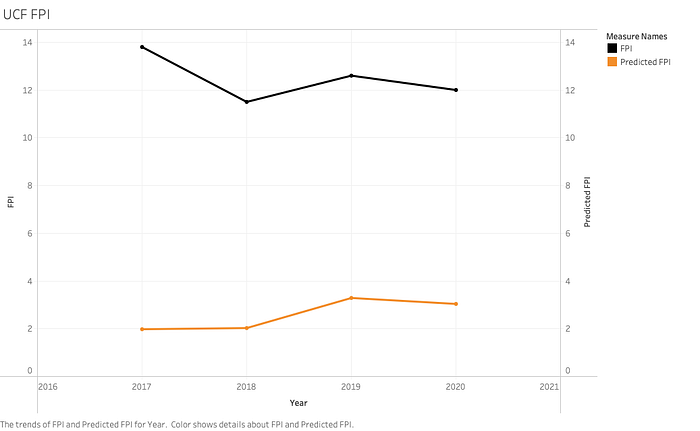
In particular, we can notice 2017 when they posted a difference of 11.82. While their talent level is certainly a little higher than those of Memphis and Appalachian State, their overperformance is still impressive and warrants a closer look at the three phases of the game.
Special Teams
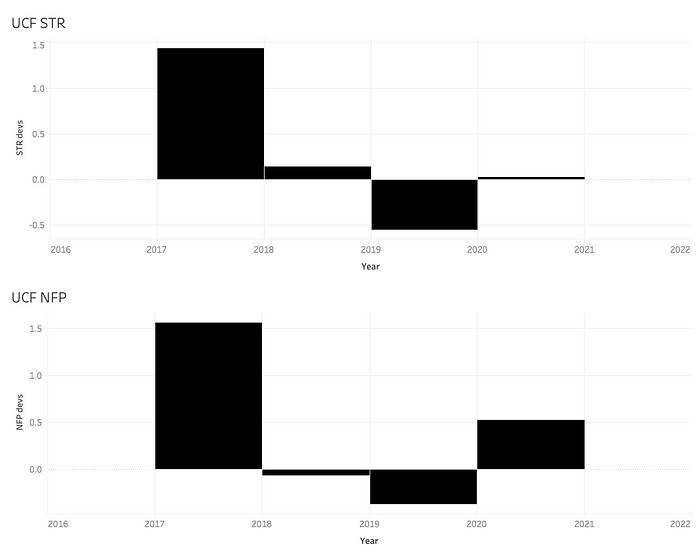
In this image, we can see that while UCF outperformed expectations a lot during their 2017 season, their special teams unit was not necessarily consistent. While the 2017 season saw them win the field position battle and perform very well on special teams, we cannot chalk up their consistency to proficiency on special teams.
Offense
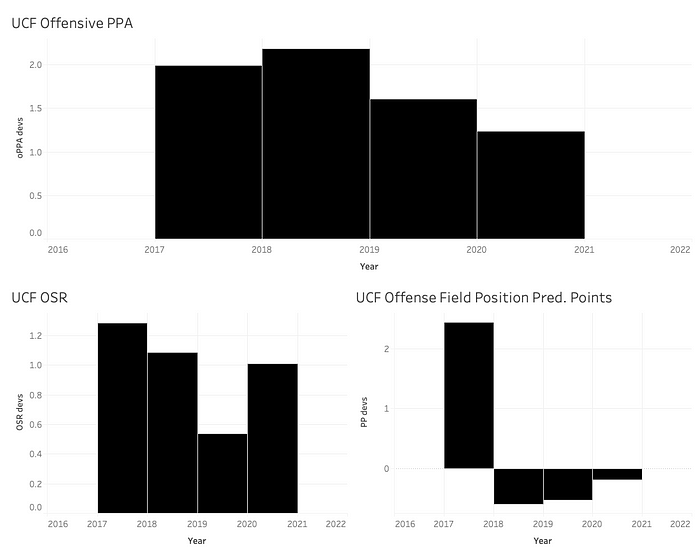
Here we can see the biggest reason for UCF’s success. In particular, UCF outperformed expectations in offensive PPA by about 2 standard deviations in both 2017 and 2018. In addition, they were above expectations in OSR as well. Although the OPP metric is less consistent, we can see that in 2017 (UCF’s best season) it was well above 2 standard deviations from the mean. Overall, we can clearly see the offense is an indicator of UCF’s consistent success.
Defense
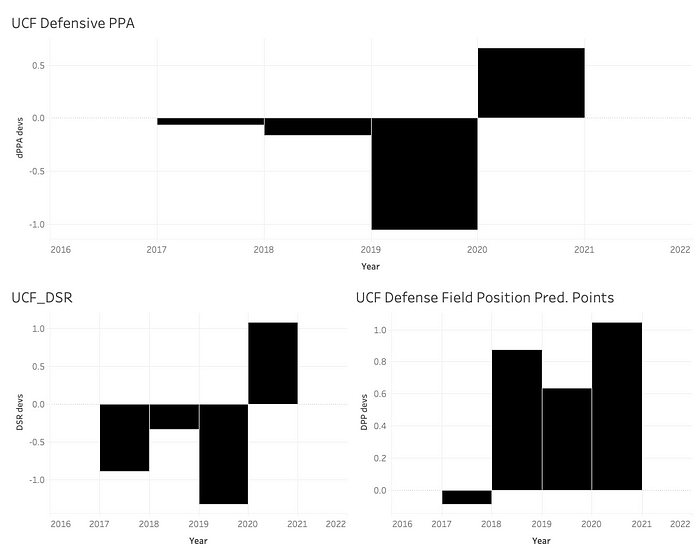
In this graphic, we see a lot less consistency. Although the defense was around expectations or a little better for a couple of seasons, it was inconsistent and cannot be attributed to UCF’s overperformance. In fact, in 2020, UCF was a full standard deviation under expectations in DSR, meaning the defense was letting teams move the ball with a lot of success consistently. Clearly the defense was more of a barrier to the success of the program.
This study showed that UCF used a high-powered offense and passable special teams to overcome a bad defense and outperform expectations. Despite a low talent level, UCF has become a model of success in the American conference(and will soon move to the Big 12).
Wisconsin
Seasons: 2015, 2016, 2017, 2019, 2020
Talent Rank (Big 10 Rank): 37(6), 37(7), 37(7), 33(7), 27(5)
FPI Rank (Big 10 Rank): 26(4), 12(3), 7(3), 8(3), 9(2)
Wisconsin is perhaps the strangest team to see on the overperformers list, as they have been a contender in the Big 10 for most of their history. But they make the list because despite being an average team in terms of talent, they have been a national contender in the last few years, particularly 2017, 2019 and 2020. Despite playing in a very competitive Power 5 conference, they continue to exceed the expectations given their talent level. So lets look at the numbers to see why they consistently outperform expectations.
Though Wisconsin is the most talented team on this list, they actually own the largest one-year difference between expected and actual FPI at 16.4 in 2017(almost 2 standard deviations from the mean). Looking at this graph illustrates how well Wisconsin has done against expectations.
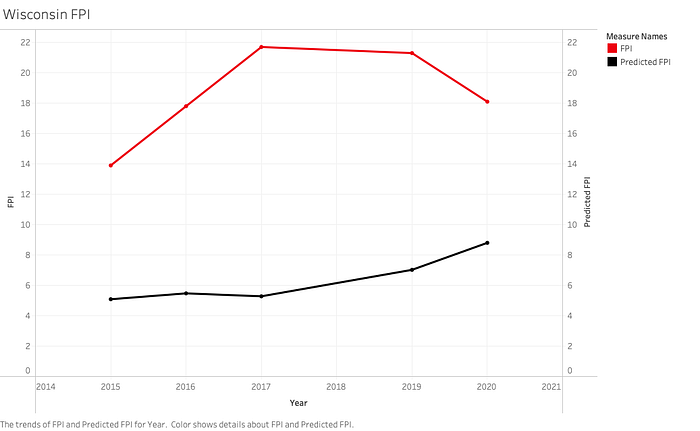
Wisconsin’s average difference of 12.2 units was second on this list to only Appalachian State (a far less talented team). The Badger’s ability to overperform even when the expectations are already fairly high is impressive, so lets look at each phase of the game to see how they are doing this.
Special Teams
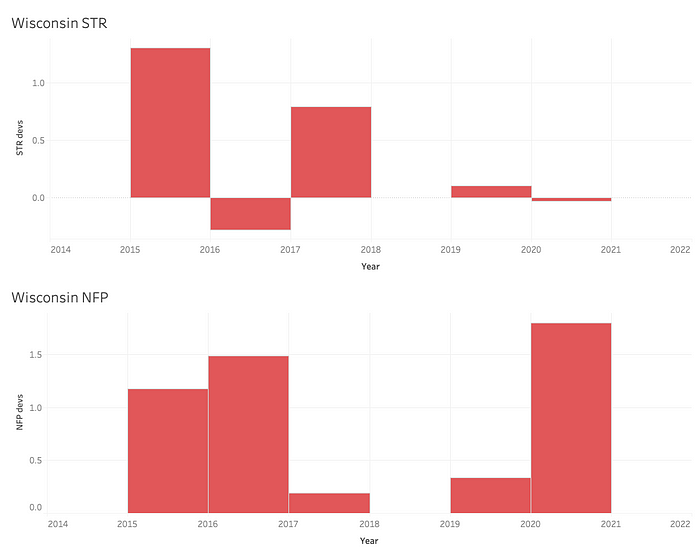
This graphic shows us that Wisconsin’s overall special teams play was fairly inconsistent, and that three of their seasons ended very close to expectations. However, we can see that Wisconsin was consistently winning the field position battle, outperforming the NFP metric each season, including a massive overperformance in 2020.
Offense
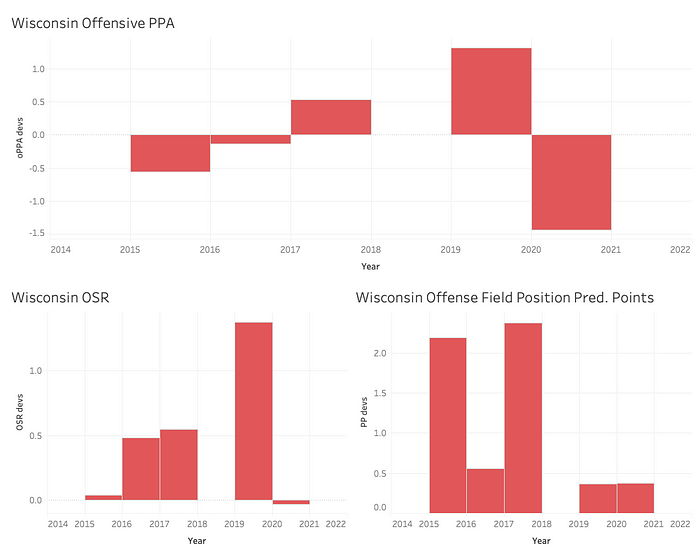
At first glance, it looks like Wisconsin’s offense has been inconsistent and not a huge part of their success. However, while they have generally underperformed relative to their predicted points, they have usually succeeded based on their starting field position (bottom right graphic). Their OSR has been mostly above expectations as well, indicating that while the offense may not be the biggest reason for the Badger’s success, it has not been a hindrance either.
Defense

Here we can see the true reason for Wisconsin’s outperformance. In both defensive PPA and DSR the Badgers consistently overperformed talent expectations by 1 and even 2 standard deviations. The bottom right graphic for DPP throws up some red flags, but since we know that Wisconsin was consistently winning the field position battle, we also know that opposing teams were starting drives deeper in their territory, meaning Wisconsin would have higher expectations for that value. Overall, we can clearly see the defense is the true driver of success in Wisconsin.
Based on this analysis, it is clear that Wisconsin is using a stout defense and winning the field position battle to consistently find success despite a relatively low talent. Wisconsin is always a tough out in the Big 10, and their defense is a huge reason why.
This study showed us some of the defining factors for teams that are consistently outperforming expectations. Whether it be stifling defense, high-powered offense, solid special teams play (or some combination of all three), teams can maximize their success despite having much lower talent than others.

Fascinating article. Well worth the read!